Hi,
Is it known when mesh collider can be added to cocos creator?
Anything planned or is it scheduled to be done with v3.0 when creator and creator3D are merged?
1 post - 1 participant
Hi,
Is it known when mesh collider can be added to cocos creator?
Anything planned or is it scheduled to be done with v3.0 when creator and creator3D are merged?
1 post - 1 participant
Version 2.4.0
I would like to put all built bundles (including default bundles eg. resources, main) onto a / several remote servers. For now I use cc.assetsManager.loadBundle(remote_bundle_url) to load custom bundles. For default bundles, I read the manual and it suggested to modify the default bundles url inside main.js (after build), which seems applicable but not very convenient. Is there an easier way to change where I load the bundles? for example changing the default loading path of cc.assetManager?
1 post - 1 participant
I want to display the slider value in a label.But when I get and display the value in a update function it is not showing.Help me with a solution please.
Thanks in Advance 
1 post - 1 participant
I tried to search the tutorial but could not find any, what is the best way to close the webview? Currently I am destroying the node completely and instantiating new web view when required but is there any better way to do it?
I followed this tutorial https://discuss.cocos2d-x.org/t/tutorial-interaction-and-hierarchy-of-webview-internal-pages/50026 , in this window.closeWebView() is used but could not find window.closeWebView in my project. Am I missing something?
1 post - 1 participant
How to create a gap between two Component properties in the properties window?
@property(Number)
private number1: number = 1;
@property(Number)
private number2: number = 1;


1 post - 1 participant
Continuing the discussion from [SOLVED] Syntax problem creating a countdown timer:
When I try to implement the same thing and display it in a label its not showing.Help me please.
1 post - 1 participant
Version 2.4.0
I thought this problem was fixed in 2.0 but apparently not.
The label is blurry with any ttf font. It is possible to solve by doubling the font size and scale down the label node by half, but it is not very convenient and incompatible with cc.Layout (cc.Layout use width/height to calculate the position of child nodes, scaling down a child node would keep the child node in the same position and leave a big gap between child nodes)
I have already been messing with the engine, is there any fix I could do to improve it?

top: font size 80 scale 0.5
bottom: font size 40 scale 1
1 post - 1 participant
Instead of using cc.find() or using node.getComponent(") or using node.getChildByName() is there a better way to keep reference of all node instead of creating a reference each time.
Thanks in advance
1 post - 1 participant
As you can see cc.Light with type ‘SPOT’ does not work in native build (Android in this case).
I’ve attached a demo project just in case.
SpotLight.zip (241.5 KB)
1 post - 1 participant
as the title metioned.
I’m hunting for a place where can communicate with other cocos creator users directly.
if anyone know this. please reply this thread or pm me.
thanks in advance.
1 post - 1 participant
cocos2dx-3.17.2
Hi I was trying to use Webview on macosx. I noticed that the experimental webview class only works for ios and android, is there a reason the macOS does not have a webview class?
I was wondering has anyone found an alternative/workaround or made a macos variant or anything similar, just wondering before i took the time to design a solution.
1 post - 1 participant
Hi all
I’m trying to change a sprite image. I’ve done this before in my game and it works fine with the following method:
mySprite->setSpriteFrame(SpriteFrameCache::getInstance()->getSpriteFrameByName("SpriteFrameName"));
Now I’m trying the following code at another location but for some reason SpriteFrameCache::getInstance()->getSpriteFrameByName("SpriteFrameName") returns nullptr, meaning it couldn’t find the SpriteFrameName. On debug mode however I did manage to find the SpriteFrameName as part of SpriteFrameCache.
Furthermore I was passing SpriteFrameCache::getInstance() from my main game class to a custom object, even though SpriteFrameCache is a singleton class so it should exist and be accessible anyway.
What am I missing here, how come I receive nullptr? Any advice would be more than welcome!
1 post - 1 participant
After import “Amazon” plugin, I run command
sdkbox set store amazon
And result
#FATAL: ‘NoneType’ object has no attribute ‘set_element’
Installation failed
Does it only change this part?
meta-data android:name=“store” android:value=“amazon”
2 posts - 2 participants
Hi, I’m seeing this crash in Google Play
#00  pc 0000000000044768  /lib/arm64/libMyGame.so (offset 0x91a000)
  #01  pc 0000000000337e48  /lib/arm64/libMyGame.so (cSceneMenuDrawing::enterTransitionStep2()+388)
  #02  pc 00000000003293fc  /lib/arm64/libMyGame.so (cBaseObject::AnimationStateEvent(spine::SkeletonAnimation*, int, spine::EventType, spine::Event*, int)+320)
  #03  pc 0000000000356b44  /lib/arm64/libMyGame.so (spine::SkeletonAnimation::onAnimationStateEvent(spine::TrackEntry*, spine::EventType, spine::Event*)+200)
  #04  pc 0000000000373324  /lib/arm64/libMyGame.so (spine::EventQueue::drain()+884)
  #05  pc 00000000003742a8  /lib/arm64/libMyGame.so (spine::AnimationState::apply(spine::Skeleton&)+784)
  #06  pc 00000000003562d8  /lib/arm64/libMyGame.so (spine::SkeletonAnimation::update(float)+88)
  #07  pc 0000000000328a98  /lib/arm64/libMyGame.so (cBaseObject::update(float)+16)
  #08  pc 000000000050172c  /lib/arm64/libMyGame.so (cocos2d::Scheduler::update(float)+452)
  #09  pc 00000000004e9408  /lib/arm64/libMyGame.so (cocos2d::Director::drawScene()+88)
  #10  pc 00000000004ebf54  /lib/arm64/libMyGame.so (cocos2d::Director::mainLoop()+132)
  #11  pc 0000000000010f40  /oat/arm64/base.odex (offset 0xa000)
and it seems to happen in the code below but I have no idea what could be the cause
void cSceneMenuDrawing::enterTransitionStep2()
{
    // Background idle
    //this->m_background->PlayAnimation("idle", true, 0.0f, 0.0f, "");
    for (auto pChild : this->m_background->getChildren())
    {
        if (pChild->getTag() == 0)
        {
            ((cBaseObject*) pChild)->SetEventsListener(this);
            ((cBaseObject*) pChild)->PlayAnimation("idle", false, .0f, 0.0f, "");
        }
    }

    // Show drawings buttons
    auto runEnterStep3 = cocos2d::CallFunc::create([this]()
    {
        this->enterTransitionStep3();
    });
    this->runAction(cocos2d::Sequence::create(playAnimationItemsShow(),
                                              cocos2d::DelayTime::create(0.5f),
                                              runEnterStep3,
                                              nullptr));
}
On the Android website I found that SEGV_ACCER means reading execute-only memory (https://source.android.com/devices/tech/debug/native-crash#xom)
Does anyone knows about this?
Thanks!
1 post - 1 participant
Both the engine and mini-games have a performance panel, which exposes the following performance indicators to developers:
Frame time (ms)
The time of each frame. RAIL model recommends making each frame of the animation in 10 milliseconds or less. Technically speaking, the maximum budget per frame is 16 milliseconds (1000 milliseconds/60 frames per second ≈ 16 milliseconds), but the browser needs about 6 milliseconds to render each frame, so 10 milliseconds or less per frame is recommended.
Framerate (FPS)
Frame rate, also called frames per second (FPS: Frames Per Second), refers to the number of frames transmitted per second of the picture, and generally refers to the number of pictures of animation or video; the more frames per second, the smoother the action will be. For example, the frame rate of a movie is 24, which means that 24 pictures need to be played in 1s, but in fact, the lowest FPS that most people can accept during the game is about 30Hz. The higher the frame rate is, the better, because the graphics card processing capacity is equal to the resolution × refresh rate, in the case of the same resolution, the higher the frame rate, the amount of data processed by the GPU will also increase sharply, causing lag. Similarly, the resolution is not as high as possible. These three related parameters will also be displayed under the performance panel of some terminals: rt-fps (runtime fps): real-time frame rate; ex-fps: limit frame rate; min-fps: minimum frame rate.
Drawcall
The CPU and GPU work in parallel. There is a command buffer between them. When the CPU needs to call the graphics programming interface, it will add commands to the command buffer. When the GPU completes the last rendering command, it will continue to execute the next command from the command buffer. There are many commands in the command buffer. drawcall is one of them. The CPU needs to process a lot of things when submitting a drawcall. This includes such things as some data, status, commands, etc. Some rendering stalls are caused by the GPU rendering speed faster than the submission speed of drawcall. Maybe the last rendering is finished and the CPU still is calculating the drawcall. The performance bottleneck of drawcall lies in the CPU. The most effective way to optimize drawcall batch rendering is to merge a large number of small drawcall into a big drawcall to reduce the number of drawcall.
Tris and Verts
Tris and Verts are the number of triangles and vertices to be rendered. There are only three basic primitives in webgl: points, line segments and triangles. No matter how complex the model is, these three basic graphs are essentially composed of vertices. The GPU draws these points into tiny planes with triangular primitives, and then connects these triangle rows to draw it. All kinds of complicated objects are drawn this same way.
Generally speaking, the lower the number of vertices and triangles of the model, the lower the complexity of the model. Therefore, these two parameters are importnat in the 3D models. For example, here are two scenarios. In the first scenario, there are 1000 objects, each with 10 vertices, and in scenario two, there are 10 objects, each with 1000 vertices. Which scenario has better performance? First of all, we must understand that GPU rendering speed is very fast. Rendering triangle primitives composed of 10 vertices and triangle primitives composed of 1000 vertices is usually the same, so there are fewer drawcalls in these two situations. Second, the performance is better. Of course, if you do some special processing on the vertices in the shader, such as complex calculations, then you have to weigh the impact of these two indicators.
If you want to reduce the drawcall, you must start with the factors that affect the rendering state, such as texture images, texture rendering mode, Blend method, and so on. In most projects, developers don’t actually have much need to modify the default rendering parameters of the engine separately. If you do it, it will definitely break batching operations.
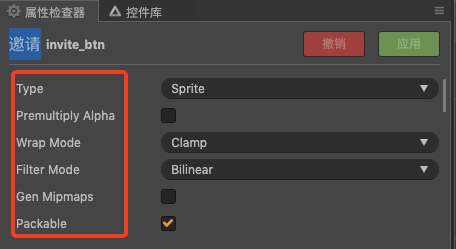
Therefore, in most cases, the biggest reduction or of drawcall in a project is actually to use the static and dynamic image combining functions provided by the engine. The static combined image is the automatic atlas, or use the third-party atlas tool TexturePacker to merge the scatter maps in the resources, and try to make the nodes in the screen use one atlas. This is because the texture of the same atlas, the states are the same, so it can meet the requirements of the rendering batch merging for the texture state. There are two dynamic pictures in the engine, one is the image resource, which is enabled by the engine by default. If you don’t want to use it, you can uncheck Packable in the panel, or turn off the global combined image switch. cc.dynamicAtlasManager.enabled = false;; one is for label, which can be done in the cache mode of label and switch between different modes. Below are some treatments and benefits of different names for drawcall in a project.
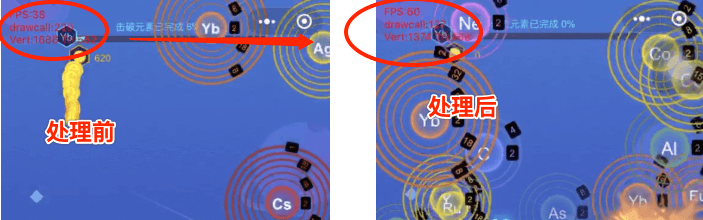
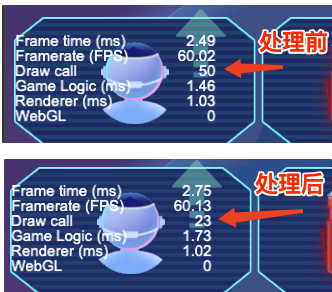
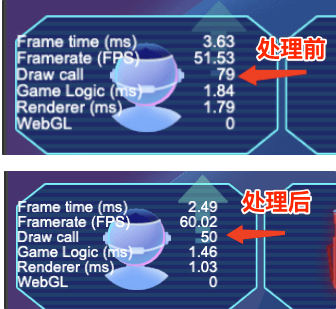
Nodes, outside the screen, can be removed directly, and drawcall has been reduced from 50 to 23:
Change the cache mode of the three labels on the homepage to bitmap, and reduce the drawcall on the homepage from 79 to 50:
There are some frequently changed label objects, when the cache mode is changed to char, the difference is not very noticeable on an Apple phone, but the fluency is very obvious on an Android phone.
When merging an atlas, it needs to be divided according to the content of the screen. Try to pack the image resources for the same screen into an atlas. Take a middle and rear level in the game as an example (the screen nodes of the previous level are too few and the difference is not obvious), the average value of drawcall dropped from 190 to 90, and the peak value of drawcall dropped from 220 to 127.
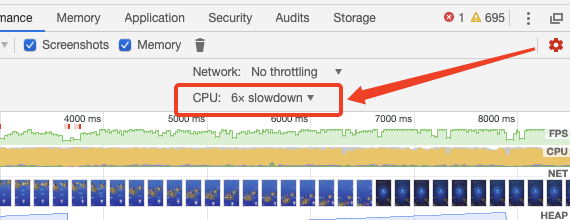
During development, the alias will use the DevTools of Chrome. If you need to block all browser plug-ins to troubleshoot performance issues in the browser, it is best to turn on the privacy mode for debugging, because the plug-ins will run in the background. This may cause interference.
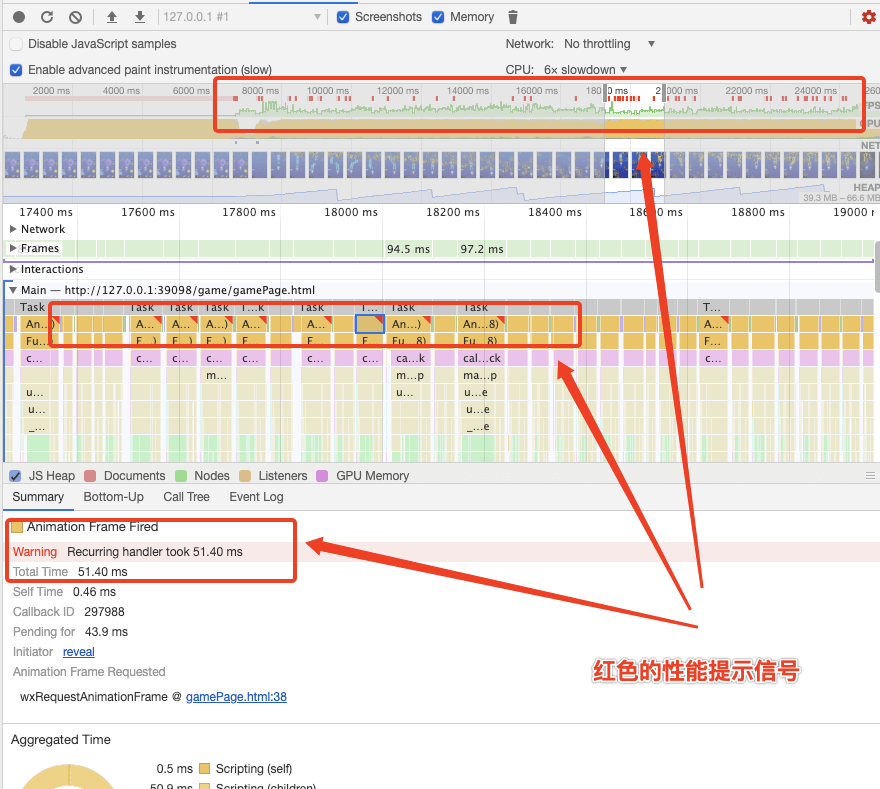
Compared with mobile phones, the CPU of desktop computers is very fast. In order to simulate the user’s hardware as much as possible, the CPU needs to be throttled. For example, when the 6x slowdown is selected, he calculation speed of the local CPU is 6 times lower than normal.
At this time, when we re-generate the recording results, we can find that a striking red warning message has appeared on the panel:
Focus, zoom in and locate the axis to each small warning message. You can see the warning message given by the browser in the Summary. The warning messages inside are all the same, they are all Recurring handler, and it appears regularly, you can use the Initiator to check the repeated occurrences and the specific execution code:
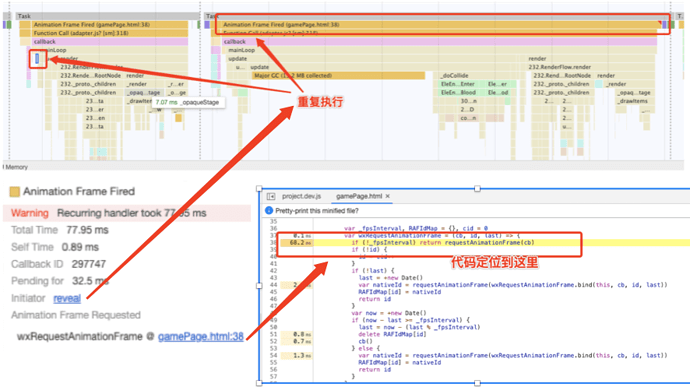
Although we have seen that the specific location of code execution is requestAnimateFrame, this api call is not created by the developer, but rather a package call of the engine. The frame callback of the engine should be implemented with requestAnimateFrame, that is to say in There may be the logic of repeated calls in the update hook, which needs further analysis here. We need to find and implement the specific business code call details step by step according to the flame graph in the Main panel, which is the JavaScript call stack. If we can locate the call function in our logic, we can solve it immediately by prescribing the right medicine. But in this project with a different name, the information given by Recurring handler is difficult to locate. The call stack below task calls the rendering method of the engine itself. Of course, if you look at the sequence of calls horizontally, it is in touchMove Run after the event, this is a troubleshooting direction, you need to analyze your own code running calls. If you encounter a situation like the synonymous, the console can only locate a bunch of engine rendering functions, but cannot clearly locate our specific business logic. The synonymous will suggest to put it away because of repeated rendering. The problem may be fixed during the splitting of long task.
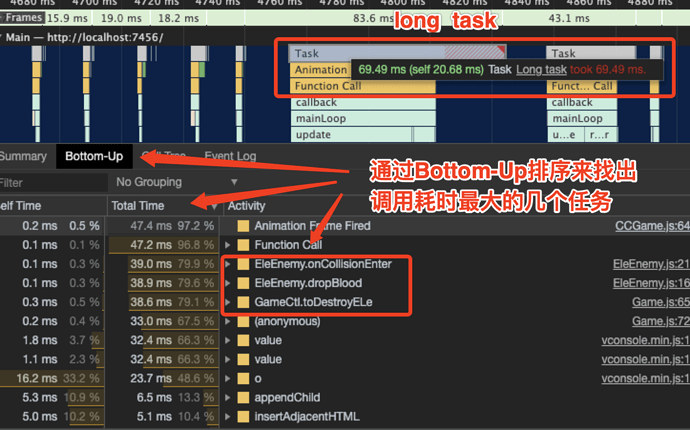
It can be generally understood that JavaScript logic with a long execution time is a long task. “Long task” occupies the main thread. Even if our page looks ready, it cannot respond to user operations and clicks. As for how long this execution time is considered long? RAIL model suggests that each task should be controlled within 50 milliseconds. Chrome also gives a prominent long task prompt in the console:
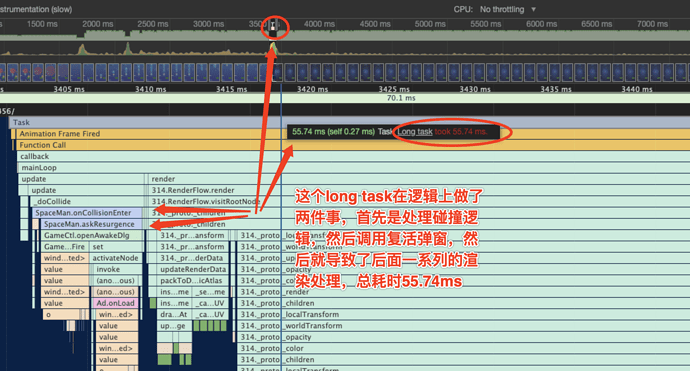
Large scripts are the main reason for long tasks. Here is a simple example of splitting long tasks in a project with different names. There is a resurrection logic in the game with a different name. The blood volume and related blood drop interactions will be processed in the collision callback. Then when the player’s blood volume is exhausted, a resurrection pop-up window will be called up, and this logic will be generated. A long task takes 55.74ms, and the flame diagram is as follows:
Analyze carefully, although my collision logic processing and evoking the resurrection pop-up window are called sequentially, there is a clear logical boundary between them, and the function askResurgence is a function that evokes the UI pop-up window, since it has been generated Performance constraints, we will do a task split here:
// Wrap it with setTimeout and place it in the next macro
// task execution
setTimeout(() => {
  this.askResurgence();
})
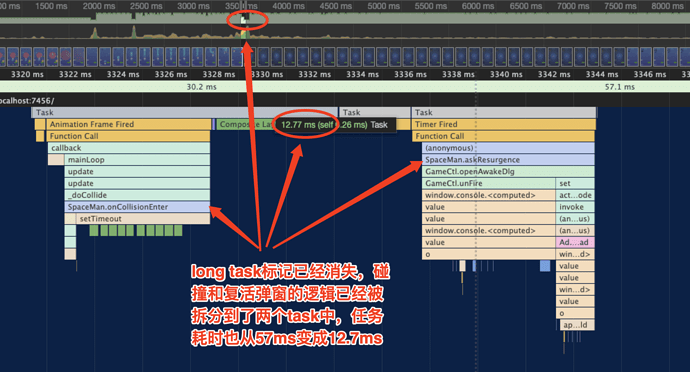
At this time we look at the split flame graph again, the long task mark has disappeared. Originally a long task was split into 3 tasks (the middle one is GC), and the time-consuming of the three tasks is added. Compared with the long task at the beginning, it is half. After sorting out the synonymous names, it was found that some very clear UI state transitions are likely to cause long tasks. There are several other projects with synonymous names that have such a clear and mixed logic. When you encounter performance pressure, you may be able to Do something like me.
To sum up, when disassembling large scripts, we first need to reorganize a large section of js logic. We can disassemble some states that can be advanced or delayed to the idle stage of our application to initialize or change, such as the game on the home page. The data needed in the process is loaded in, and there is no need to load this part of the data in the logic of the game process, but this is a relatively “macro” logical change, but in most cases our state and logical changes are difficult Early or late. We can also do some logic splits with smaller time granularity, which is to combine the event loop mechanism of js to process our logic, such as using Promise.then or setTimeout to delay the task, or even create a Task queue to do event caching, etc. This article idle-until-urgent introduces some more specific dismantling script measures. Task splitting is risky. Whether it is to improve or delay logic at the application level, or use js microtasks or macrotasks to delay state logic, it may cause problems with your application state synchronization. Remember to test the entire process after the actual operation.
Long tasks can also be optimized by streamlining their own logic. For example, in some loops, if you can jump out to determine whether you have done it. In some places, whether the logic you write is redundant or useless, such as in projects with different names. Interaction logic:
// Animation interaction with little effect, kill
this.node.setScale(1.2);
const frequency = getRandom(15, 40) / 100;
this.centerNode.runAction(
  cc.sequence(
    cc.scaleBy(frequency, 1.1),
    cc.scaleTo(frequency, 1)
  ).repeatForever()
);
In the actual picture effect, this small change is actually very weak. It can be considered as a dispensable animation logic. Then we need to decisively treat it when doing performance optimization. After deleting the redundant logic, the value of game logic can be clearly reduced.
At present, there are more obvious performance aspects: heat, easy to freeze when the number of enemies increases.
Heat is a relatively comprehensive problem. Generally speaking, the CPU causes heat, and reducing the CPU’s work will effectively reduce the heat. Stuttering is more affected by the frame rate and drawcall, usually the following optimization methods:
drawcall optimization should be further explored.1 post - 1 participant
hi,
i have a vertical scrollview inside which i have multiple horizontal scrollviews as rows. now , the vertical scrollview only allows vertical scrolling and the horizontal scrollviews allow only horizontal scrolling. the horizontal scrolling works just fine for each row, but when i touch on any of the horizontal scrollviews and move my finger vertically the view doesn’t move vertically. how can i make the view move vertically by touching on any of the horizontal scrollviews?
Note: i can’t make the vertical scrollview both vertical and horizontal (and remove the horizontal scrollviews) , as the horizontal scrollviews need to scroll independently of each other.
thanks!
1 post - 1 participant
I successfully created raycast, thanks to cpp-test examples.
But when I use Follow::createWithOffset on my hero then raycast only works on initial screen!
raycast draws but doesnt recognise collisions after initial screen
Is there any way to fix this problem?, Thanks
1 post - 1 participant
I have a cocos2d-x game that I want to be ported to Switch, Xbox, and Ps4. Pm me if you are up for it.
1 post - 1 participant
I just downloaded Visual Studio 2019 and the Game Development with C++ workload, which says it includes tools to work with Cocos. The workload downloaded Cocos Creator, but I don’t know how to start using Visual Studio 2019 with Cocos Creator. All the posts I find about are either outdated, or they only talk about VS Code, not VS 2019. Can anyone point me in the right direction? Thank you so much!
4 posts - 2 participants
Hi !
I am new on cocos, I just want to move a 3D box on z-axis continuously with JavaScript. How can I move it. . ?
1 post - 1 participant